Posts
August 2023
Pontrelli Dissertation
May 2023
Pontrelli dissertation defense
I would like to thank Dr. Laurie Baise for her continuing support of this research, insightful comments, attention to detail, and weekly meetings. She backed me through high and low periods in the process of developing this dissertation with a steady hand and an eye towards the future. Laurie is an amazing mix of administrator, scientist, engineer, technician, teacher, and good person who makes everyone around her better. She is the best advisor a PhD student could ask for. Dr. John Ebel was an instrumental voice during my PhD who calmly and consistently identified what was right with the work I was doing and then clearly suggested what he believed still needed to be done. This clarity and confidence he showed was essential during difficult episodes of data processing and decision-making about methodological paths forward. A quote that will always stick with me that he said repeatedly is “The science is fine, you need to stop worrying about it. What you need to do is write more clearly and present your work so the audience can understand it”. Dr. Jon Lamontagne began at the same time as I did at Tufts and has been there for me to talk about statistics and academic life for my entire time here. He has guided me in statistical analysis and optimization as well as communicated with me in informal meetings that are small, yet over time, powerful. Dr. Juan Pestana was my Earthquake Engineering professor and introduced me to time-domain analyses of site response and provided a historic and holistic setting for the practice. Dr. Jack Ridge helped me grow as a professional and a person with his kind guidance and constant support – we had a great time in Death Valley too.
Thank you to my family. My Mom, Heather, has been an inspiration to me as she has to many. She has driven me to always strive for excellence in my work and in my life and, most importantly, has steered me to continually try to be a good person. It was also nice having someone to commiserate with about bad reviewers. My Dad, Mike, had breakfast with me practically every week in graduate school. He supported me constantly, and his weekly wisdom helped me find my way forward in tricky situations. We talked about everything under the sun which was fun and insightful – I have loved having someone to share ideas with. My partner, Laura, has been a rock in my life during my time in graduate school. She is inspirational, caring, and insightful and spent hours listening to me when I had issues, providing support and guidance. My sister, Eva, is herself a PhD student and has been a source of excellent wisdom and witty insight on graduate school life. She has been so insightful about the PhD process because of her own success in one, something that inspires me. My brother, Bobby, provided me with consultation over the years offering guidance and helpful support through new situations I found myself in. To all these loved-ones and the many more who directly and indirectly supported me, thank you and I love you.
Thank you to the faculty of the CEE department especially Drs. Rob Viesca, Jack Germaine, Lucy Jen, Chris Swan, Luis Dorfmann and others who provided the intellectual and personal support in the office to made this dissertation possible. Thank you to the administrative staff on whom I constantly rely for aid: Laura Sacco and Debra Mcknight. There are several people outside of Tufts who were extremely technically influential on my work and my skillset. Dr. Steve Mabee of the Massachusetts Geological Survey at UMASS Amherst let me participate in the depth-to-bedrock project which turned into the third chapter of this dissertation. This project had extraordinary ambition and a long-term mentality built on decades of meticulous data collection that was eye-opening to me. It was an honor to work on it and I am so grateful. Steve was amazing letting me be a part of the project and guiding me along the way. Both Chris Duncan and Bill Clement also worked on this project and met with me individually multiple times to discuss technical issues about the spatial model and geophysical models, respectively. Weiwei Zhan was a postdoc at Tufts during the second half of my PhD and had the technical skills I wanted to have and more. He could identify my issues exactly providing specific guidance to challenging problems having gone through the same issues himself. Finally, Jim Kaklamanos, was hugely inspirational to me. I read all his work and then spent time with him asking deeper technical questions. He shared his years of wisdom in these sessions graciously. Jim is extremely organized, practical, creative, nice, and relatable. He runs a tight ship that I and his students appreciate, and which makes everything easier, something that I try to emulate. Thank you to all these people for the time they put in mentoring me and guiding me on my research journey.
Thank you to my colleagues: Christina Sanon, Adel Asadi, Catherine Knox, Jeremy Salerno, Alex Chansky, Lekan Sodeinde, Lichen Wang, Parker Aubin, Stephen Lambert, Deniz Ranjpour, Vahid Rashidian, Fatemeh Kazemiparkouhi, Illaria Cinelli, Avis Carrero, Mark Zoblacki, Sofia Puerto, Caitlin Barber, Flannery Dolan, Ashkan Akhlaghi., Liz Fletcher, Amanda Parry, Justin Reyes, Azin Mehrjoo and many others all of whom have had enormous influence on me and become my friends. Finally, thank you to all the amazing students I have had the privilege of working with in all the classes I have taught and TA’d.
April 2023
SSA 2023
March 2023
Chapter 1 publication
Pontrelli, M.A., Basie, L.G., Ebel, J.E. (2023a) Regional-scale site characterization mapping in high impedance environments using soil fundamental resonance (f0): New England USA. Engineering Geology, Vol. 315, doi: https://doi.org/10.1016/j.enggeo.2023.107043
October 2022
ESSA 2022
August 2022
Dissertation proposal
April 2022
Characterization of Soil Amplification in Glaciated Terrains: Collaborative Research with Boston College
(June 2020 through May 2021) USGS Award No. G20AP00040
Principal Investigator: Laurie Baise
SSA 2022
December 2021
AGU 2021
October 2021
ESSA 2021
April 2021
SSA 2021
February 2021
Downloaded the Fairchild (2013) HVSR database on the Cape and plotted fundamental resonances.
January 2021
SSA 2021 Bliss Corner Event Abstract
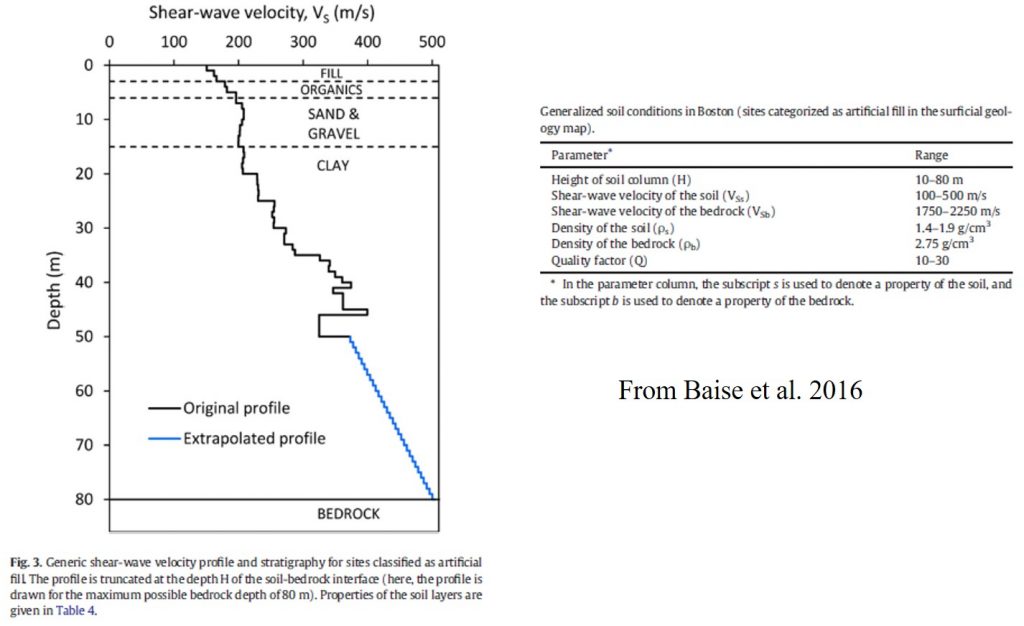
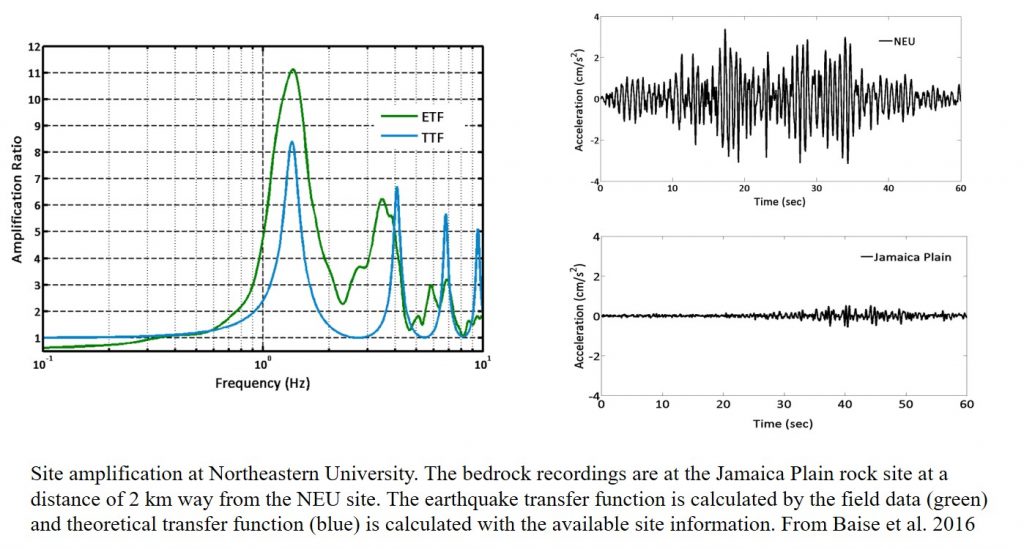
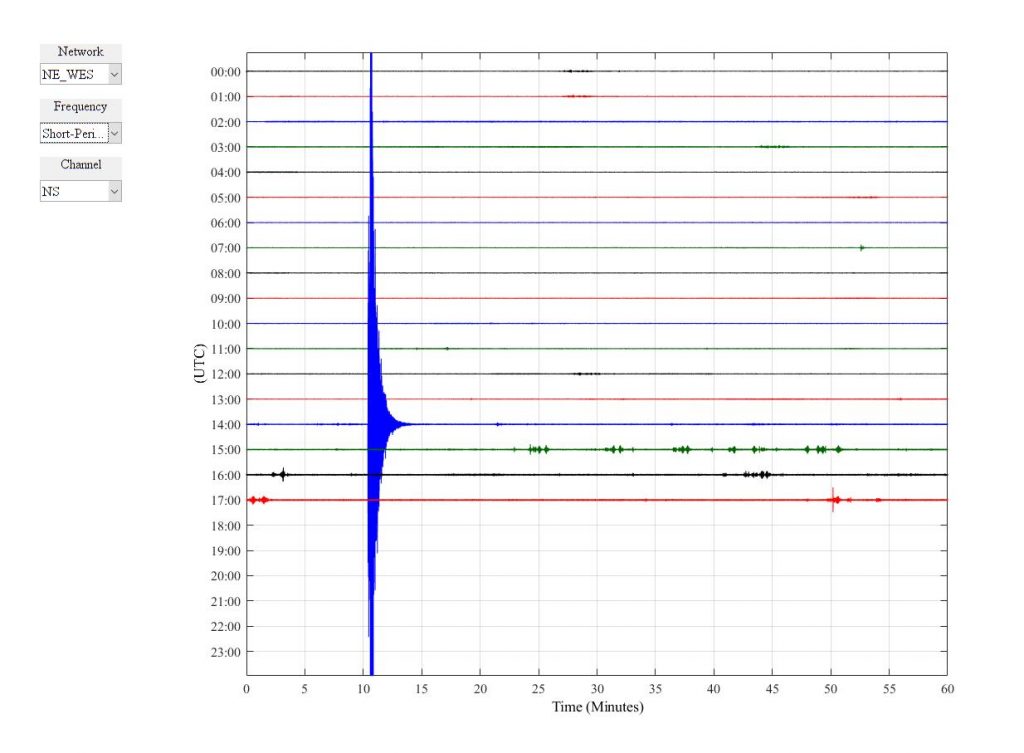
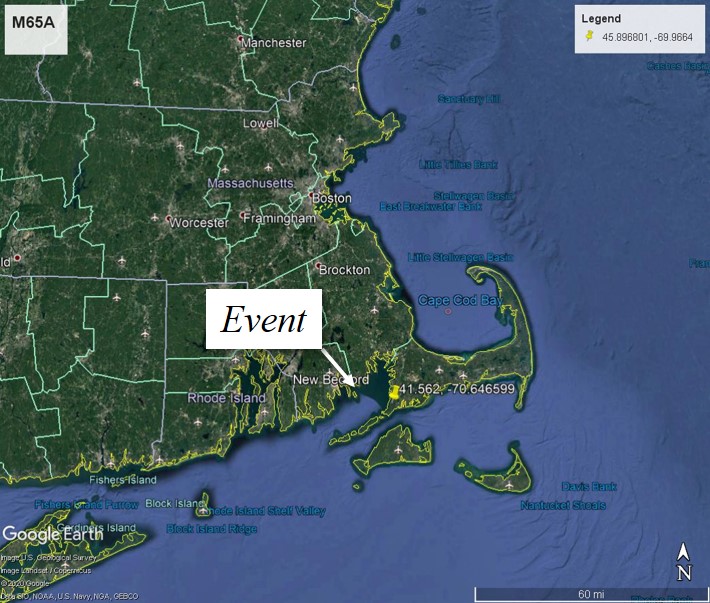
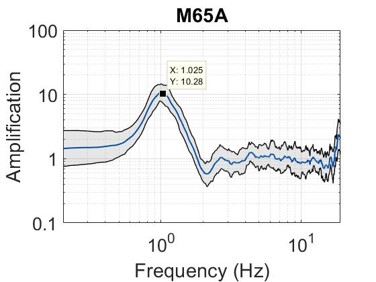
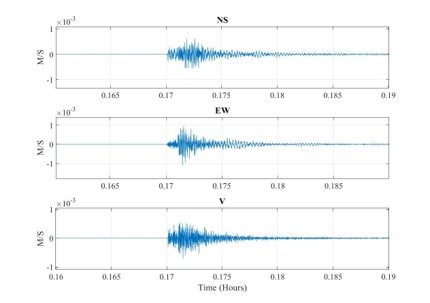
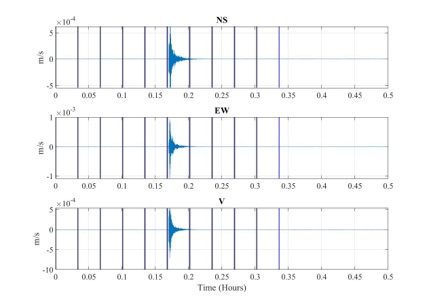
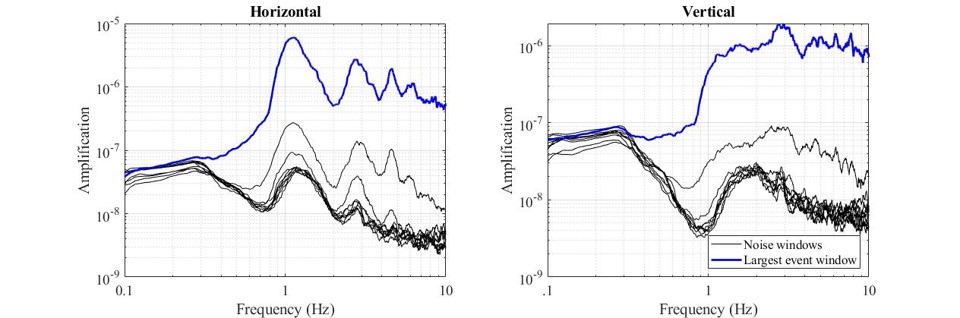
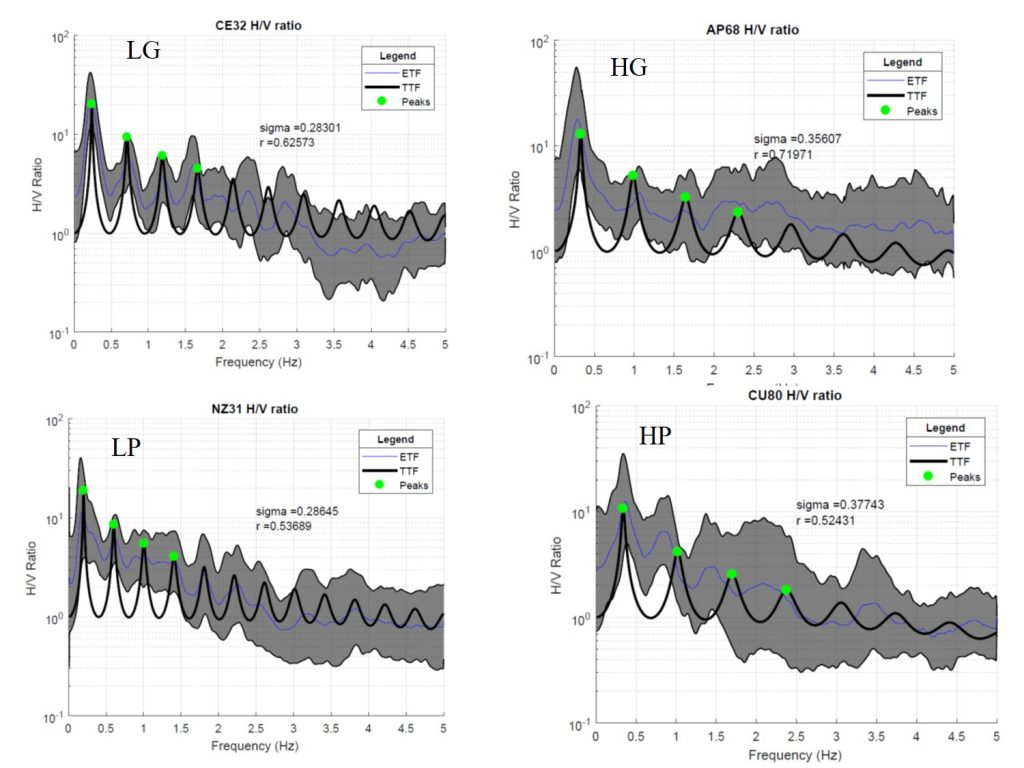
The magnitude 3.6 Bliss Corner, Massachusetts earthquake occurred on November 8th, 2020 causing weak to light shaking (II-IV ShakeMap MMI) along the southern and eastern shores of the state, including in the city of Boston. Although the event only caused minor damage to buildings in the vicinity of the epicenter, there were still app. 29,000 USGS Did You Feel It? reports generated in the Eastern US. Most reports were concentrated in New England, with some reports hundreds of kilometers from the epicenter, possibly indicative of the low attenuating properties of the bedrock underneath the Central and Eastern US (CEUS) region. The Boston Basin and surrounding surficial geology is composed of various soil types including thick layers of resonating clay, sand and till. These glacial sediments and clays are relatively low-velocity (200-300 m/s) and overlay competent, high-velocity (>2000 m/s) bedrock, causing an amplification of seismic waves within engineering frequencies of interest in certain locations (Baise et al. 2016). Using strong and weak motion seismic stations in and around Boston, we compute Horizontal-to-Vertical Spectral Ratios (HVSR) to estimate soil fundamental frequency from both ambient waveforms and the Bliss Corner earthquake. We compare these empirical estimates to synthetic estimates produced using local geologic and engineering data. Additionally, we measure and map Peak Ground Accelerations in the Boston area during the earthquake. Events of this magnitude are rare in Massachusetts, and thus provide an excellent opportunity to understand soil resonance and amplification in a densely populated, urban region.
SSA 2021 New England Glaciated Terrain Site Response Abstract
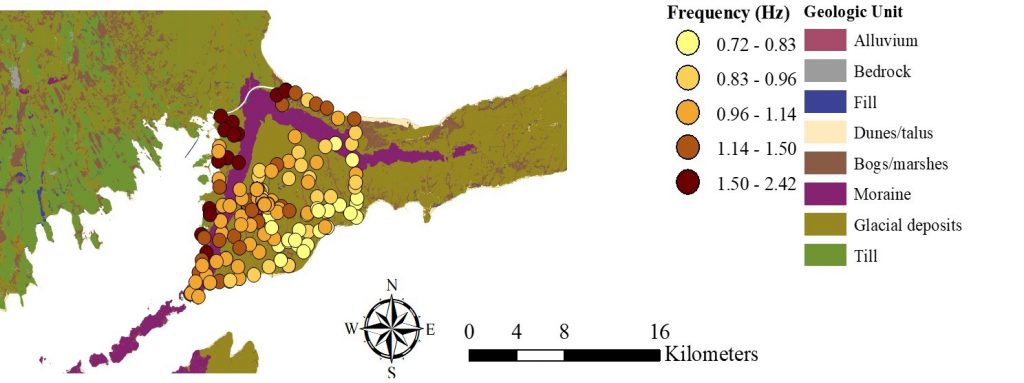
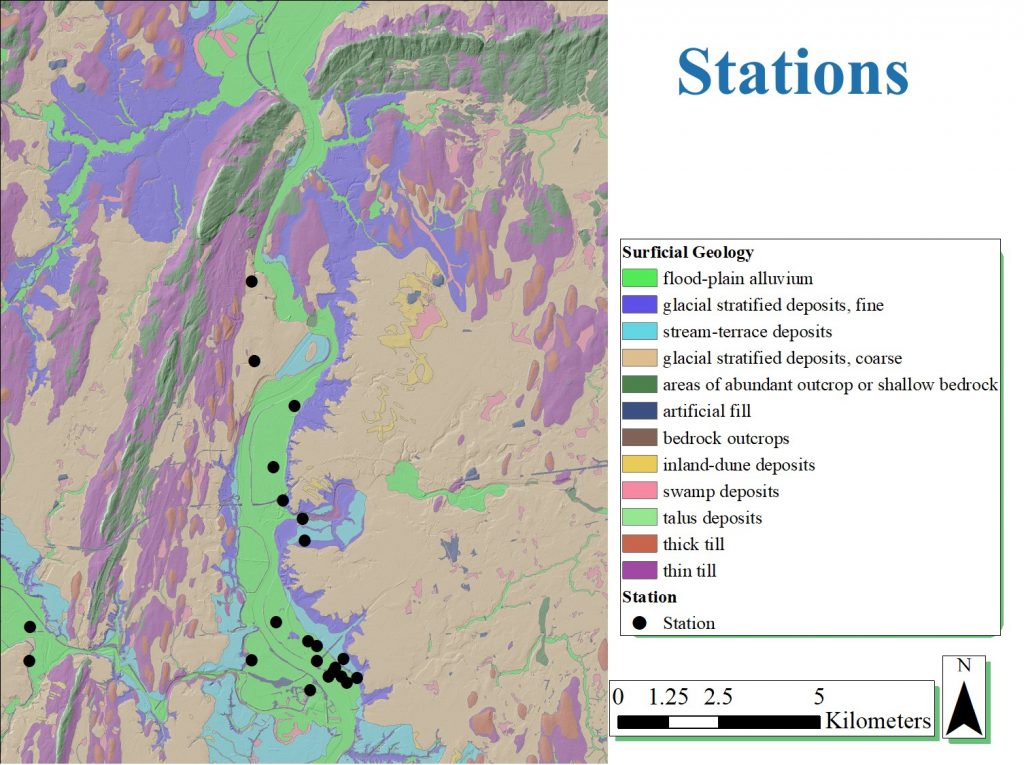
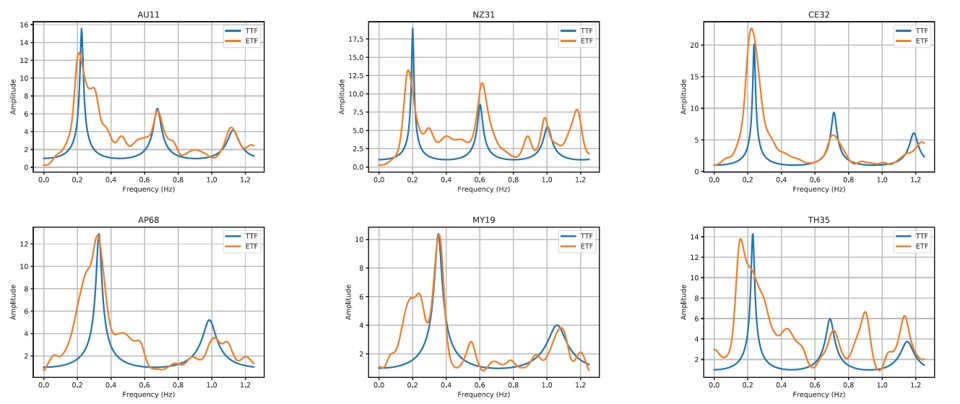
Near surface geology plays an important role in earthquake ground motion estimation and thus is a vital area of study for infrastructure resilience. Soil profiles with lower velocity sediments overlying higher velocity bedrock amplify energy at certain frequencies due to resonance effects and conservation of energy across an impedance boundary. The NEHRP estimates this site amplification using Vs30: the average shear wave velocity of the top 30 meters of soil. Vs30 is a good preliminary step in estimating site amplification, but it does not 1) provide information concerning the depth to the impedance boundary which determines the frequency of shaking and 2) capture effects from soil deeper than 30 meters. In this study, we use two measurements, Multi-channel Analysis of Surface Waves (MASW) (Park 1998, 1999) and the Horizontal to Vertical Spectral Ratio (HVSR) (Nakamura, 1989) to provide greater constraint on site near surface S-wave velocity profile than Vs30 alone. MASW estimates S-wave velocity profiles using surface wave dispersion and HVSR provides the site fundamental frequency, f0. We can combine these measurements to estimate two parameters that define the site amplification: 1) f0 and 2) the average shear wave velocity to the impedance contrast. We study three glacially derived surficial geologic units in New England: 1) glacial lakes, 2) river basins and 3) marine clay deposits and within each unit, calculate the fundamental resonance using the HVSR and a dispersion curve using MASW at multiple sites and identify variability within and between units. We find that in the field, the addition of an HVSR measurement is easy and well worth the time to supplement the MASW derived S-wave profile and show that a site can be characterized this way using f0 and shear wave velocity to the impedance boundary, a similar, but slightly more robust classification than Vs30 alone. Our results will ultimately be used to develop updated soil amplification maps for the New England region.
December 2020
Report on data collection in the Pioneer valley: “Near surface shear wave velocity profile development in the Pioneer Valley and Tufts Campus using a coupled HVSR-MASW technique”.
November 2020
Field work in the Pioneer Valley

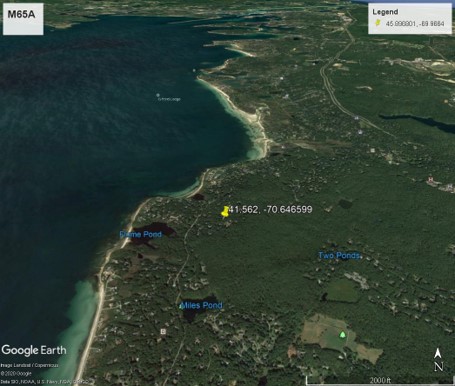
November 8, Bliss Corner Event
October 2020
2020 Eastern Section of the Seismological society of America Meeting
July 2020
Marshall Pontrelli PhD qualifying exam
Civilization depends on the complex and chaotic natural systems from which humanity arose. While these natural systems support life, providing the human species an environment within which remarkable civilizations have developed complex economic and societal systems, they also cause destruction and catastrophe. Humanity’s painfully slow and jerking progress is a function its ability to reduce these complex systems into simpler, understandable cause and effect models of reality that allow it to increase its predictive ability and thus minimize destruction and maximize creation. Despite the simplicity of these models in relation to actual nature, this strategy has been remarkably successful. The key to understanding natural systems and thus increase the likelihood of the progress of humanity is to ask and systematically strive to answer the questions: how does order arise from chaos and what are the laws that underpin reality?
The earth is a complex environment made from many interacting dynamic systems all of which provide input to the anthropogenic systems necessary for human survival. The interests of this exam are the causes of the plate tectonic system on human systems. Plate tectonics is a model of the crust’s dynamism creating earthquakes in the form of energy propagating as seismic waves. These waves go through many processes which morph them as they move through space and time until they reach human construction at the surface of the earth and interact with civil infrastructure. This interaction causes nuisance and discomfort when and where societies are prepared and death and destruction when and where they are unprepared.
This exam is composed of four disciplines: earthquake engineering, digital signal processing, environmental statistics and geomechanics. Earthquake engineering describes the set of problems that arise from earthquake wave propagation and its interaction with human infrastructure. These problems are aptly solved using combinations of tools from digital signal processing and statistics to analyze vibration data from the earth or in civil systems. These data analyses fall within a theoretical framework provided by analytical solutions in geomechanics describing material properties, wave propagation and the relevant parameters therein. Solving these problems 1) moves forward our understanding of how seismic energy affects humanity, 2) quantifies the interaction between seismic energy and civil infrastructure and 3) develops an ordered framework describing a chaotic system thus allowing for prediction useful to the advancement of human society.
May 2020
Geomechanics final
December 2019
AGU
September 2019
The Tufts University Medford/Somerville campus sits on a northwest-southeast trending glacial drumlin composed of compact glacial till. The underlying bedrock is predominately Cambridge argillite with a vein of the famous Tufts quartzite and intrusions of diabase dikes and sills. The drumlin sits in unconsolidated glacial outwash of predominately sans. The subsurface beneath the Alumni fields to the east consist of artificial fill, formerly Boston Blue Clay which has subsequently been removed by an old brick factory.
August 2019
Marshall Pontrelli Master’s thesis
Mexico City
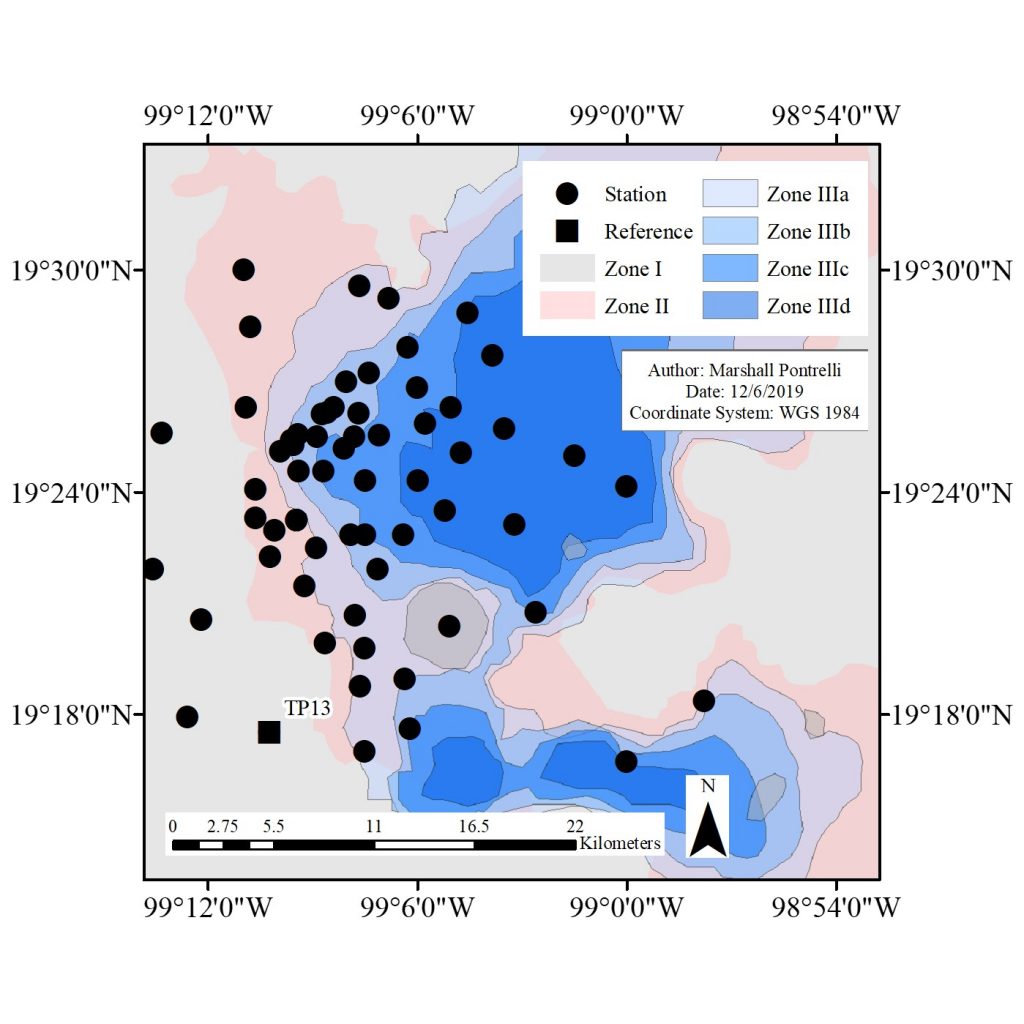
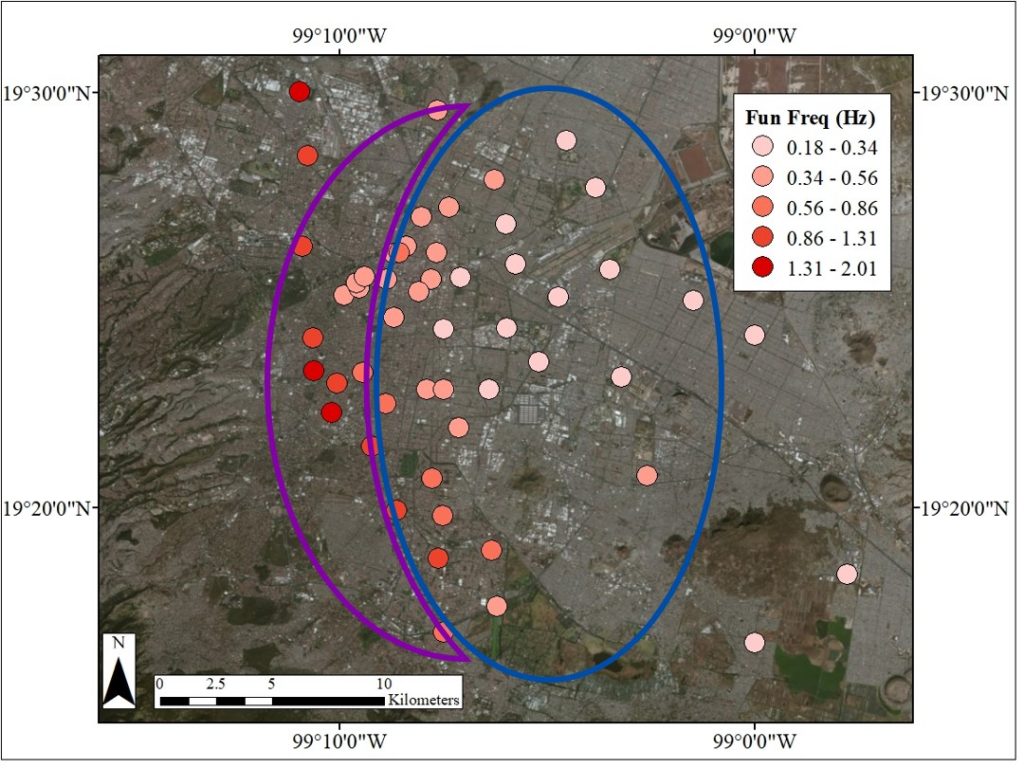
Following the 1985 Michoacán earthquake, the government of Mexico City installed the RACM network in partnership with the National Autonomous University of Mexico (UNAM) to provide ground motion data for basic research to assess and mitigate vulnerability within the Mexico City basin. Since 1987, 80 devices have recorded 259 events at 72 surface and 8 borehole stations (CIRES). Of these, we use 218 events recorded at 70 stations: 52 lake zone stations, 8 transition zone stations, 4 compact stations, and 6 hill zone stations (Fig. 1) to map changes on HVSR shape across the basin.
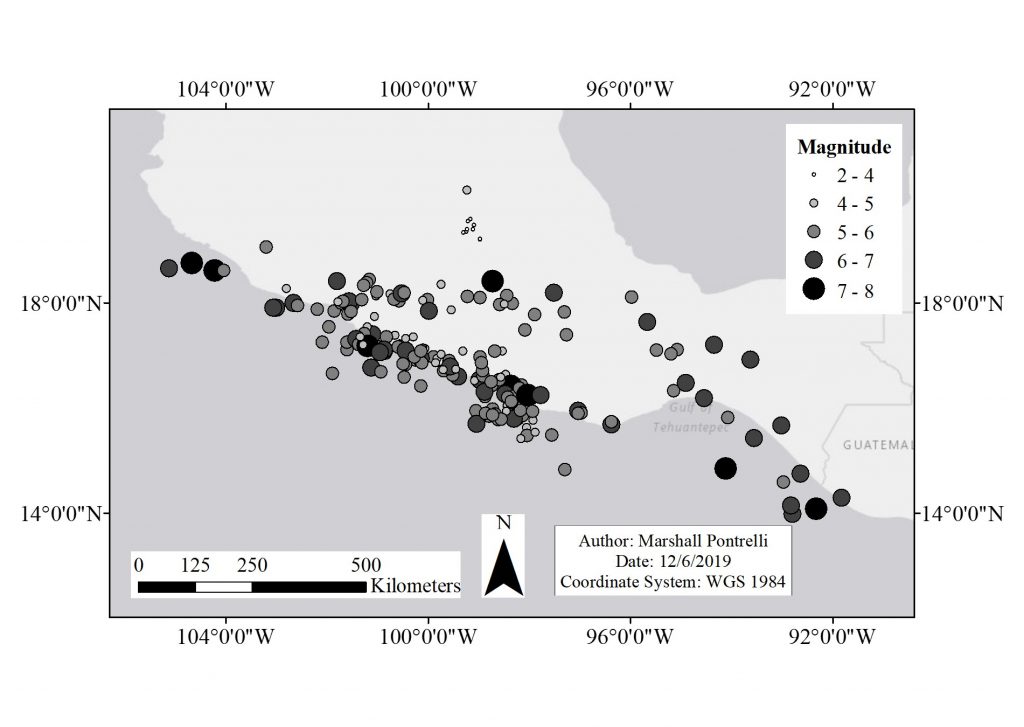
Mexico City is in one of the most seismically active regions in the world at the confluence of four tectonic plates: the Cocos, North American, Rivera and the Caribbean. Most of the events recorded by the RACM network have epicenters on the subduction zone between the Cocos and North American plate (Fig. 2). The events in the database have a minimum magnitude of 2.5 and a maximum magnitude of 8.2 with most events coming from a southern azimuth.
June 2019
International Conference on Earthquake Geotechnical Engineering (ICEGE)
May 2019
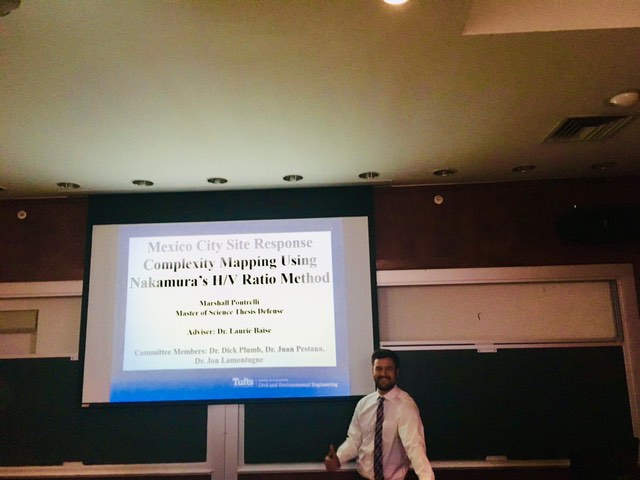
Marshall Pontrelli Master’s thesis defense
March/April 2019
Seismology Student Workshop and Seismological Society of America
November 2018
NE Geotech Graduate Research Symposium
May 2018
Seismological Society of America
March 2018
Seismology Student Workshop
Boston Basin is an indentation in the Massachusetts Coastline. It rises gently from beneath Boston Harbor inland until the topography steepens north to the Fells Upland, west to the Needham Upland, and south to the Blue Hills. The bedrock that forms the basin edge dates back more than 540 million years during the Precambrian eon, some at a time when the land was volcanically active, others when a massive pluton of magma from Earth’s mantle intruded into the crust and crystallized. In addition to these very old rock, two types of sedimentary bedrock are found within the Boston Basin: Cambridge Argillite and Roxbury Conglomerate deposited between 540 to 300 million years ago. Cambridge Argillite is a shale—fine grained particles deposited in a marine environment—found to the North in Cambridge, Somerville, and downtown Boston. Roxbury Conglomerate –stones cemented together in a matrix of clay and sand—is to the south in Newton, Roxbury, and Brookline. Early settlers thought the conglomerate looked like plum pudding, so they called it Roxbury Puddingstone.
For several hundred million years following the Cambridge Argillite and Roxbury Conglomerate formations, erosion and tectonic forces removed, faulted, and folded the bedrock, creating the bedrock landscape that exists today. The most recent geologic alteration has been due to glaciation. From about 2.5 million years ago until its final retreat from Boston 23,000 B.P, the Laurentide Ice Sheet swept back and forth across the region eroding, transporting and depositing material. In addition, the weight of hundreds of feet of glacial ice caused the crust to sink. The glacier carved the Bostin Basin out of the softer Cambridge Argillite and Roxbury Conglomerate and deposited glacial till in smooth, sloped, elliptical hills called drumlins that are seen today as the hills and islands of the Boston Basin. As the ice sheet melted, the crust rebounded at a faster rate than the oceans filled, causing sea level relative to land to sink 23 meters at around 10,500 B.P. Post glacial clays now referred to as “Boston Blue Clay” deposited in the marine environment and left deposits up to 50 meters. Sea level slowly rose to its current position and the Boston landscape was as it was when Europeans first laid eyes upon its shores.