
The Misinformation Maelstrom: A Mapping of Vulnerability Across America
The two major political parties in the United States are in an all-out sprint leading up to the 2020 presidential election. Neither has had a shortage of digital mediums to amplify their views to the public. The American public’s increased reliance on social media as a source of news is worrisome because of the propensity of these platforms to spread misinformation. The COVID-19 pandemic has only exacerbated this trend, tethering people ever more to their personal electronic devices and fostering a boom of both digital crime and misinformation.
A new study from Digital Planet explores which states are most, and least, vulnerable to misinformation. The research team at Digital Planet considered five evidence-based indicators: political polarization, education, age, traditional news viewership, trust in social media news. Digital Planet’s model uses the following definition, put forth by Princeton University Professor Andrew M. Guess and University of Utah Professor Benjamin A. Lyons, for misinformation: “a claim that contradicts or distorts common understandings of verifiable facts.” While other subsets of misinformation, such as disinformation, are not isolated variables in this model, they are included under the broader umbrella of misinformation in this analysis.
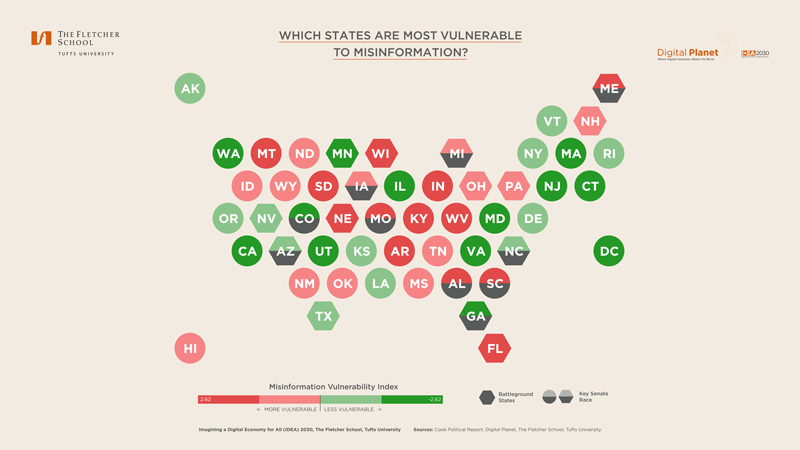
The visual above maps these findings with each state ranked from most vulnerable (dark red) to least vulnerable (dark green). Further, states are marked if they are (1) battleground (or swing) states and/or (2) key Senate races.
From a political lens, the most closely watched and highly competitive races are disproportionately in areas vulnerable to misinformation. Of the top 25 most vulnerable states, 12 are either in a battleground state or have a key Senate race approaching. In the 25 least vulnerable states and the District of Columbia, there are seven of such races ahead.