
How to Read a Causal Loop Map
Causal loop maps provide a visual representation of the dynamic relationships among elements of a system and make explicit an analysis of the underlying structure that give rise to the patterns of behavior.
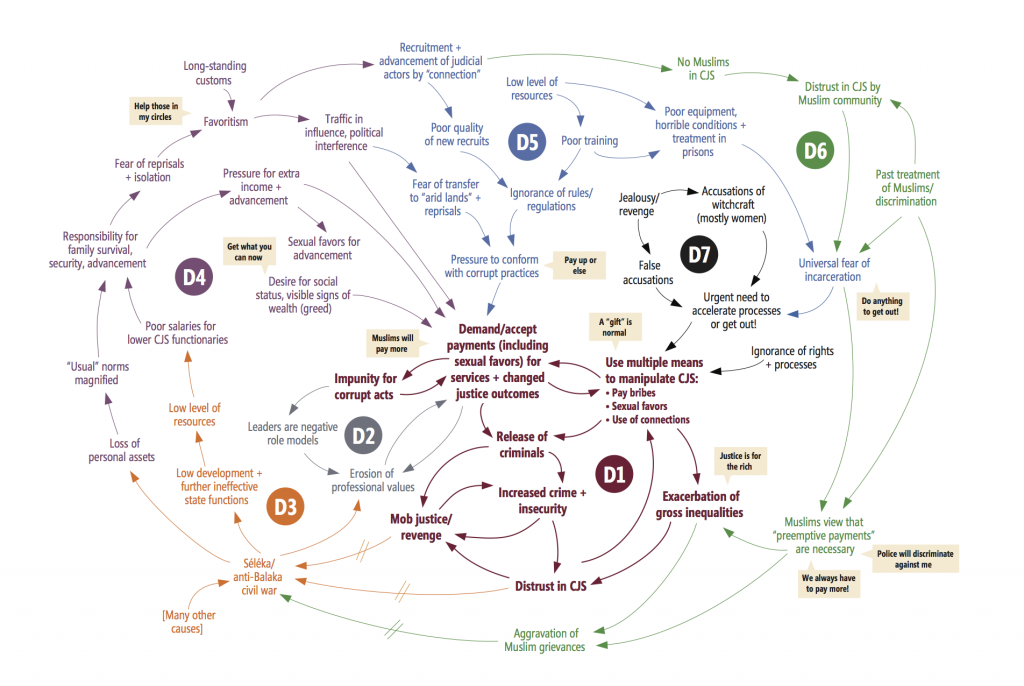
A causal loop diagram, or systems map, explains how multiple factors in a context interact to drive or enable particular patterns of corrupt behavior. The map itself provides a visual representation of the dynamic relationships among elements of a system, and makes explicit an analysis of the underlying structure (the inter-relationships among factors) that gives rise to the patterns of behavior.
The map consists of:
- Factors: drivers, enablers and effects of corruption.
- Mental models/social norms: ways of framing or thinking about issues, generally implicit, that may determine behavior.
- Causal links, depicted as arrows: showing the relationship and direction of influence between variables. When they are all in the same direction, this means that as one factor goes up so too does the next factor.
- Time lags or delays between cause and effect: An arrow with two strokes across it means that there is a time delay in the relationship. That is, the cause may lead to an effect only after a period of time.
See causal loop maps in action in the Corruption, Justice and Legitimacy Program’s Corruption as a System Project offering technical assistance to implementers and donors as they integrate corruption analysis into their program development or evaluation process.