c. Importing a matrix dataset
Importing a matrix dataset:
In both cases whether you are importing a wide or tall version of your matrix data you will want to import the file in CSV format. Your data may require some cleaning for VUE to be able recognize the matrix, if you have questions about how your data needs to be formatted be sure to ask on the VUE User Forums.
- Select Windows > Datasets. The Content: Datasets window opens.
- On the Datasets toolbar, click the Add Dataset tool. The Add Dataset window opens.
- Enter a Display Name for the dataset
- Set the address field to the path of the dataset file by using the file chooser.
- Set “Import as Matrix Data” to true.
- Click “Continue”
- Now you will be prompted to identify the matrix data as wide or tall. Follow on to the next section depending on which type of data you are importing.
Importing a wide matrix dataset:
- Example of data
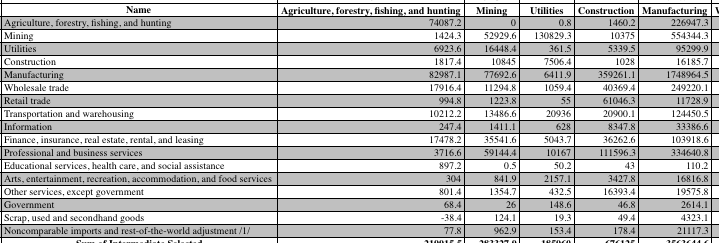
This data looks like a typical distance matrix with the first row and first column representing entities, and the joining number in the chart representing the relation between the entities.
- You will need to answer 4 questions about this data, first what is the pivot attribute. The pivot attribute is normally the first row/column in wide data. It should generally be the attribute you want to be marked as the Node entity.
- Next, you will need to tell VUE how the size of the X by X matrix. You need to this so that VUE can determine what pieces of data in the CSV make up the matrix, and which are supporting metadata for the entities. In most cases this may just be equal to the number of rows in the CSV file-1.
- Next, you can tell VUE to optionally ignore relationships matching a particular pattern. In our test use-cases we found this useful for ignoring 0 relations between entities resulting in a cleaner output graph.
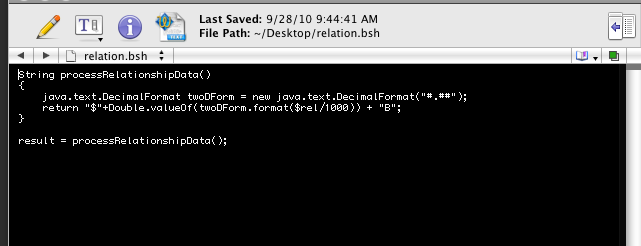
- Finally, You can optionally provide a path to a script which will scrub the relation data and format it in some way. You may not need to use this. In our test-cases this was useful in formatting numbers into dollars. (The scripting language here is BeanShell)
- Now Click Continue
- The dataset Records list will populate and you can now drag data out on to the map.
- A rough tutorial video on working with wide matrix data is available here:
- http://screencast.com/t/MGY2ZDkwY
Importing a tall matrix dataset:
- Example of data:
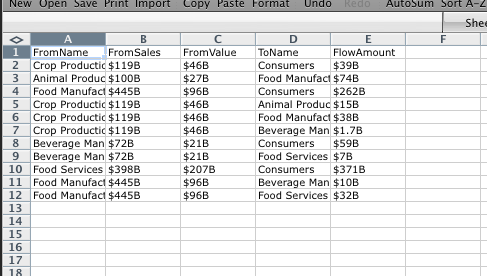
As you can see in the data above, this is data is essentially a distance matrix with FromName, and ToName representing source and target entities, and FlowAmount representing the relationship between the entities. All other columns are assumed to be metadata of the Entities.
- You’ll need to specify 3 things for tall data. First, You’ll need to specify what the Row equivalent is in the tall data by selecting the appropriate column from the drop down.
- Next, you’ll want to specify what the Column equivalent by selecting the appropriate column name from the drop down menu.
- Finally, you’ll want to specify which Column represents the relationship data from the drop down menu.
- All of Columns of data in this format are assumed to be metadata of the entities.
- Click “Continue”
- Records can now be dragged onto the map.
- A rough tutorial video on working with tall matrix data is available here:
- http://screencast.com/t/NTc5YTNm
Refreshing a dataset
Refreshing a matrix dataset works the same as a regular dataset or RSS feed see “Importing a dataset or a RSS feed” for more information.